Replacing Pneumatics: EQT Shows the Path Ahead
EQT has demonstrated that decarbonization makes sense at scale. Now it’s time for the rest of our league to follow suit. When ready, execute these workflows with astonishing rapidity at ComboCurve.

EQT Corporation recently published a fantastic white paper called Pneumatic Device Replacement: Low-Cost Opportunity for Methane Abatement. EQT is the largest natural gas producer in the United States and is at the forefront of decarbonization activities in the industry. The company undertook a project to replace over 8,000 natural gas-driven pneumatic devices across its asset base by the end of 2022.
In doing so, EQT reduced its methane emissions intensity by 65% versus 2018 levels.
What’s A Pneumatic Device?
Pneumatic control devices use compressed gases to control or operate machinery or equipment. In oil and gas production, they control the flow of fluids in pipelines and other equipment. These devices vent gas as part of their design, releasing large amounts of methane (CH4) into the atmosphere.
Pneumatics driven by natural gas only uses the pressure energy of high-pressure gas. Any potential combustion energy to use the natural gas as fuel is wasted. This process is highly-inefficient and only done when natural gas is the only high-pressure gas source available to the site. You will also see pneumatics when alternatives like electrification or air compressors were uneconomic or infeasible when the original operator built the facility.
Since methane (CH4) is a particularly potent GHG, with a Global Warming Potential (GWP) of 28-84 times that of carbon dioxide (CO2), it has been the focus of many early-stage reduction regulations and targets. Since methane is also one of the leading products of oil and gas operators, they are uniquely well-positioned to take action to reduce this GHG, often at a “cost per tonne avoided” that is much less than competing GHG reduction opportunities. Some projects may even offer attractive rates of return instead of an adverse cost or revenue reduction.
With a total projected cost of $20 million, this begs the question; if replacing pneumatics makes financial sense at scale, can it work for smaller operators and situations?
Pneumatic Replacement Scenarios
The first step to evaluating a pneumatics replacement campaign is carrying out a pneumatic device inventory. When performing inventory, first determine the number of pneumatic devices, categorize them as High Bleed, Low Bleed, or Intermittent, and finally identify how changes will impact production equipment. Include installation costs and any associated facility downtime in your economics.
Inventory complete; it’s time to consider alternatives.
Best Alternatives to Pneumatics
To abate methane venting from pneumatic devices, operators have several choices.
Replace High-Bleed with Intermittent or Low Bleed devices – Quick, easy, and less downtime, but it does not fully solve the problem.
Replace natural gas with compressed air – Innovative design and smaller packages have made air compression affordable, allowing smaller facilities to use instrument air instead of conventional air compressor packages. In addition, higher compression package cost is offset by reusing the same controllers and tubing in air service, provided they are purged of methane to prevent explosions.
Compressed inert gases such as nitrogen – Instead of purchasing a compressor package, you can get compressed inert gases like nitrogen in bottles or bullets. The capital cost is much lower, but the monthly operating cost (supply cost) can be expensive in high-volume applications.
Replace with electronic controllers – This option may have the lowest GHG emissions, depending on the source of the electricity. However, it can often be the most expensive, especially if electricity is unavailable at the site. Although electronic controllers generally have a higher price tag than pneumatic controllers, they provide more extensive data and process control options. For several use cases, the “total cost of ownership” can be more favorable for electronic controllers. If electrical power is unavailable at the site, the cost of running new lines, poles, and transformers can be prohibitive.
Modeling Emissions with Carbon Network™
While we are not privy to how EQT determined the economics of its replacement project, we can use a Carbon Network™ in ComboCurve’s ComboCarbon module to run our own numbers on a set of representative wells. We will simultaneously quantify emissions reductions and calculate the impact on real asset economics, like Net Present Value (NPV).

To run multiple scenarios quickly, we incorporate all facility emissions in a Carbon Network™. We can use this digital replica of our assets to modify inputs and show numerous alternative facility designs. We can also use the project workspace’s economic and production forecast data to show GHG and associated economic impacts.

Economic Assumptions
With the economics of scale, EQT received an outstanding return on its $20 million investment. Reducing carbon intensity by 65% is an astonishing accomplishment.
But if it makes sense at 8,000 devices, will it still make sense at 16? To figure that out, we begin with a host of economic assumptions.
We begin with 16 analogous wells and forecast them within ComboCore.

We then combine production forecasts and emission estimates into one asset. Given the asset size and vintage, we assume 28 Intermittent Bleed pneumatic devices for our virtual asset. Pipeline-grade natural gas powers these assets, which are often about 95% methane and 1% CO2. At 95% uptime for the year, the Run Time hours clock in at 8322 hours. We cap the expected remaining economic life of the wells at 15 years.

Other associated production equipment and activities for typical production facilities include oil tanks, flaring, liquids unloading, compression, and process combustion. We have these items, but since they remain constant for each Scenario, we only include them for accuracy. For example, we assumed an oil tank flash gas rate of 0.1 Mcf flash gas per barrel of oil and routed those emissions to flare in our Base Case.
Economic Model Inputs
For the Scenario where we replace pneumatics with non-emitting controls, we set the Carbon Network Model pneumatic device count to zero. At the same time, we increased the Capex model by $2,500 per well, which is a reasonable estimate for replacing pneumatics in the field – accounting for purchase, labor, and downtime costs.
Treating these wells as a single centralized well pad covered by one air compressor could result in a similar total cost of $70,000, equivalent to a single small novel-design air compressor package. Therefore, we could cover a device swap and an air compressor with the same Capex model. Opex model costs increased by $100 per well per month to cover the energy and operating expenses for any newly added equipment.
Emissions Results
We now plug 16 wells and 28 pneumatic devices over a 15-year lifespan into an Emissions Reduction “Combo” for the forecasted wells. Total GHG emissions in CO2-equivalent (CO2e) is the sum of all GHG gases adjusted for global warming potential (GWP).
Looking at the emissions Delta between Base and No Pneumatics shows we can reduce CO2e by 21,588.59 metric tonnes for these wells over this time. This equates to 51.40 tonnes per device yearly, which aligns with EPA emission factors for Intermittent bleed pneumatic devices operating on pipeline gas at 95% uptime.

What does this mean in dollars and cents?
By reducing the assumed $50.00 per tonne charge, expenses decreased by nearly $235,000, and cash flow increased by over $615,000. This resulted in a net NPV increase of $345,000 at a 10% discount rate. Even with a Capex charge of $3.27 / tonne of CO2-e and $100/month/well of added expense, the project has a net positive benefit of $16.00 / tonne of CO2-e. Even at our much smaller scale, you make more money under this Scenario.
Follow EQT’s Lead
They say the NFL is a league of copycats. The rest of the league follows when a team shows how to use a particular strategy to win championships. Energy producers operate along similar lines. EQT has demonstrated that decarbonization makes sense at scale. We saw how the case to replace pneumatics is equally vital for small operators and facilities with as little as 16 wells. Now it’s time for the rest of our league to follow suit. When ready, they can execute these workflows with astonishing rapidity at ComboCurve.com.
See how your team can go from forecast to economics in minutes with energy’s fastest analysis engine.
Related Posts
The State of GHG Emissions Planning in Oil and Gas
Even the most ambitious energy transition plans still include the production and consumption of significant amounts of oil and gas until 2050 and beyond.

Three Reasons Oil & Gas Companies Are Planning for Net-Zero
Reduce exposure to regulations, create transparent future emissions forecasts to attract capital, and enable a balanced mix of sustainable energy sources.
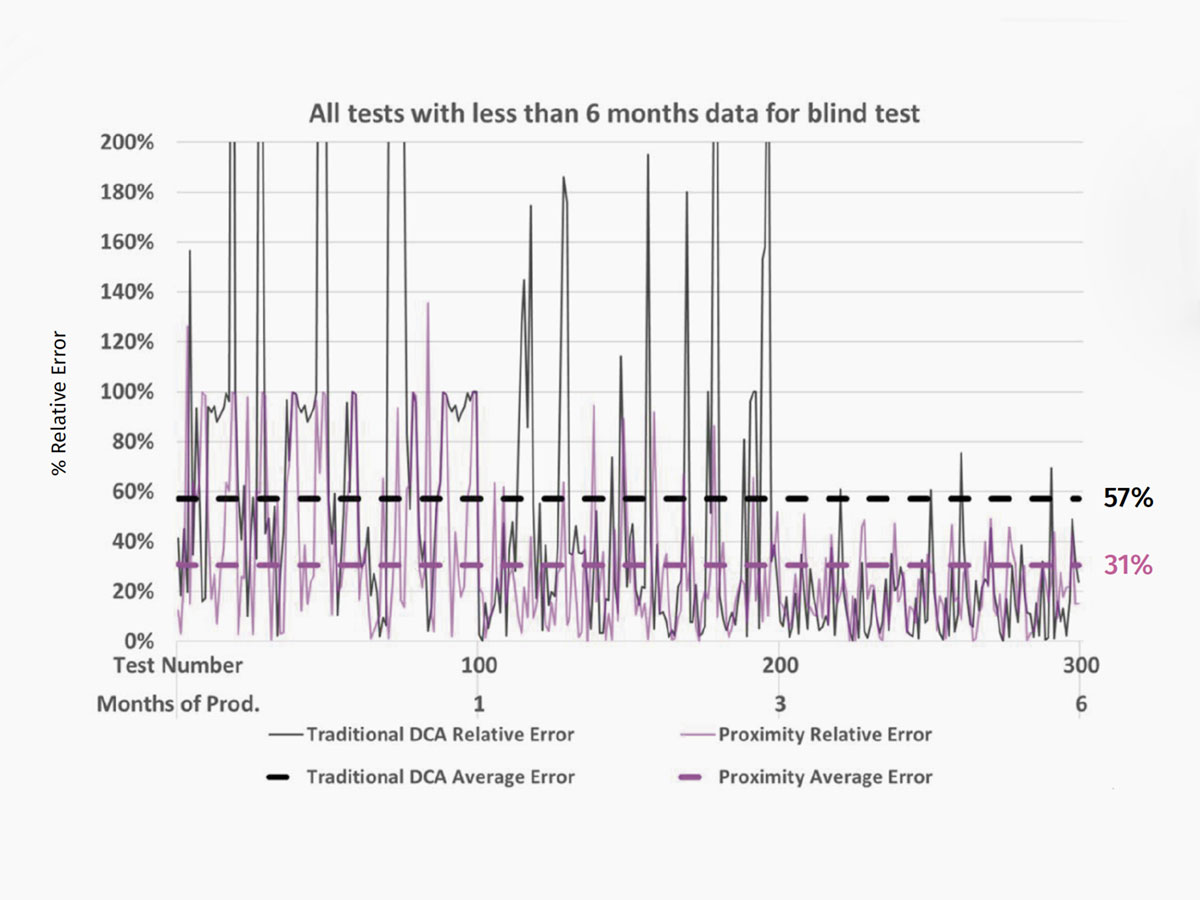
ComboCurve Proximity vs. Traditional DCA Forecast: A Comprehensive Comparison Study
ComboCurve’s proximity workflow generates a forecast with a much lower error compared to the traditional DCA.