Forecasting
Efficiency at Scale
Skyrocket productivity and focus on innovation while ComboCore handles complex forecasting.
Compliant Precision
Tailor your analysis to meet industry standards, ensuring both flexibility and accuracy.
Historical Insights, Instantly
Inform your decisions with past and present data comparisons for actionable insights.
Type Curves
Holistic Intelligence
Facilitate strategic decision-making across the entire production landscape.
Accuracy, Simplified
Get statistical confidence to make robust informed decisions across multiple risk profiles.
Geospatial Intelligence
Add a geographical perspective to your workflow to speed-up well selection.
Economics
Multitasking Made Easy
Run up to 10 scenarios concurrently to quickly get a comprehensive view of your project’s economics.
Real-Time Market Insights
Get immediate access to crucial pricing data to create accurate and timely financial forecasts.
First-Pass Precision
Save time while streamlining production reports with automated cut-off calculations.
Bring together forecasting, type curves, and economics in a single tool with ComboCore.
Forecasting
Key Features
- Auto-forecast: Automatically forecast 25,000 wells in minutes. Type Curves: Create probabilistic multi-segment type curves based on SPEE guidelines.
- Compare & Merge: Compare past and current forecasts to quickly gain historic insights.
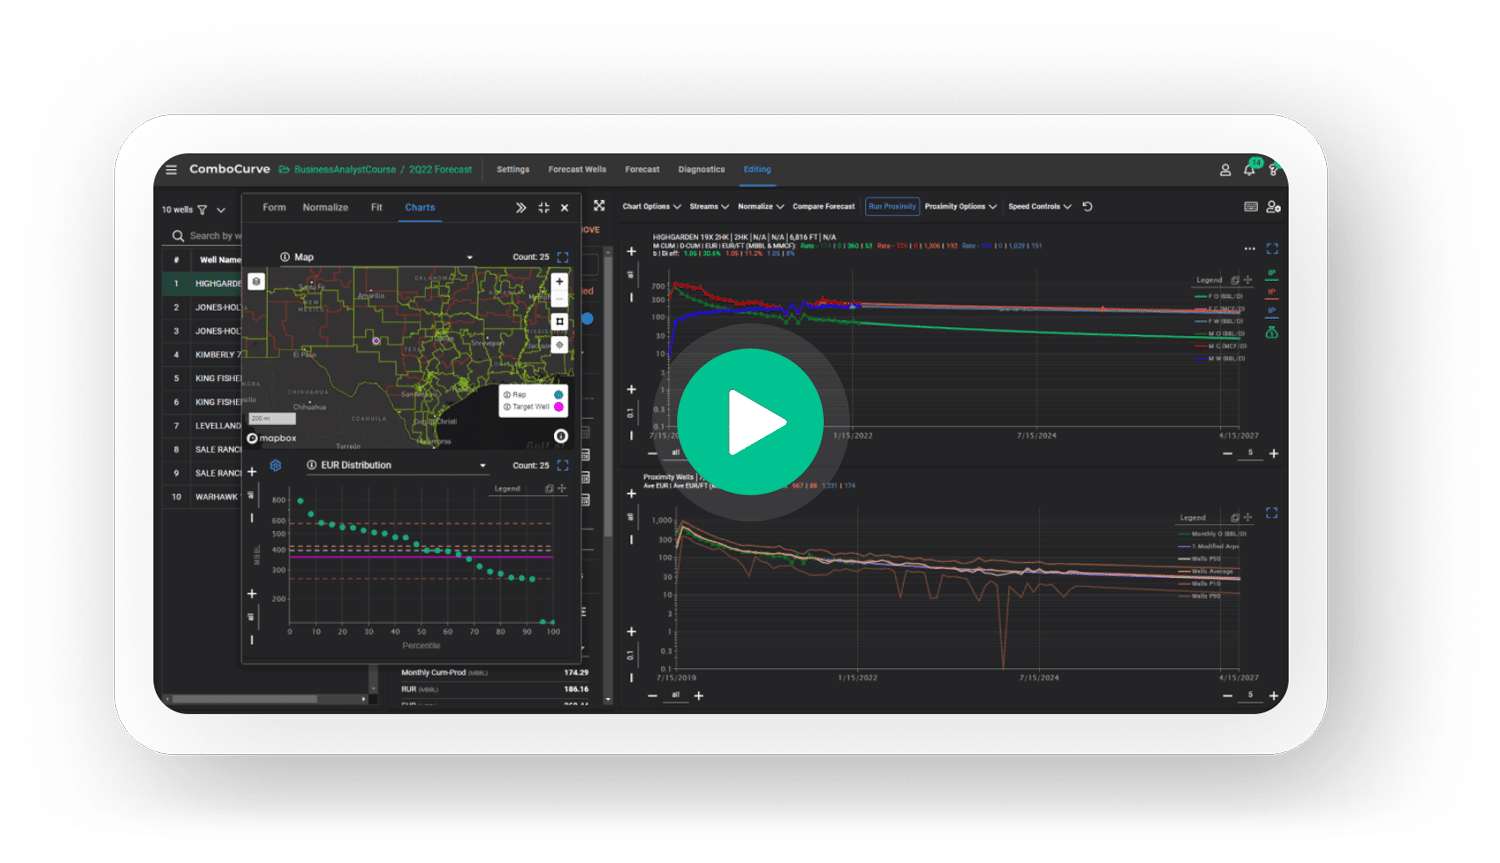
- Offset Well Forecasts: Generate production forecasts for early life wells using data from nearby analogs with Proximity Mode.
- Workover Economics: Generate incremental economics for workover considerations.
- Diagnose Outliers: Filter and manually correct outlier wells with a few clicks.
Type Curves
Key Features
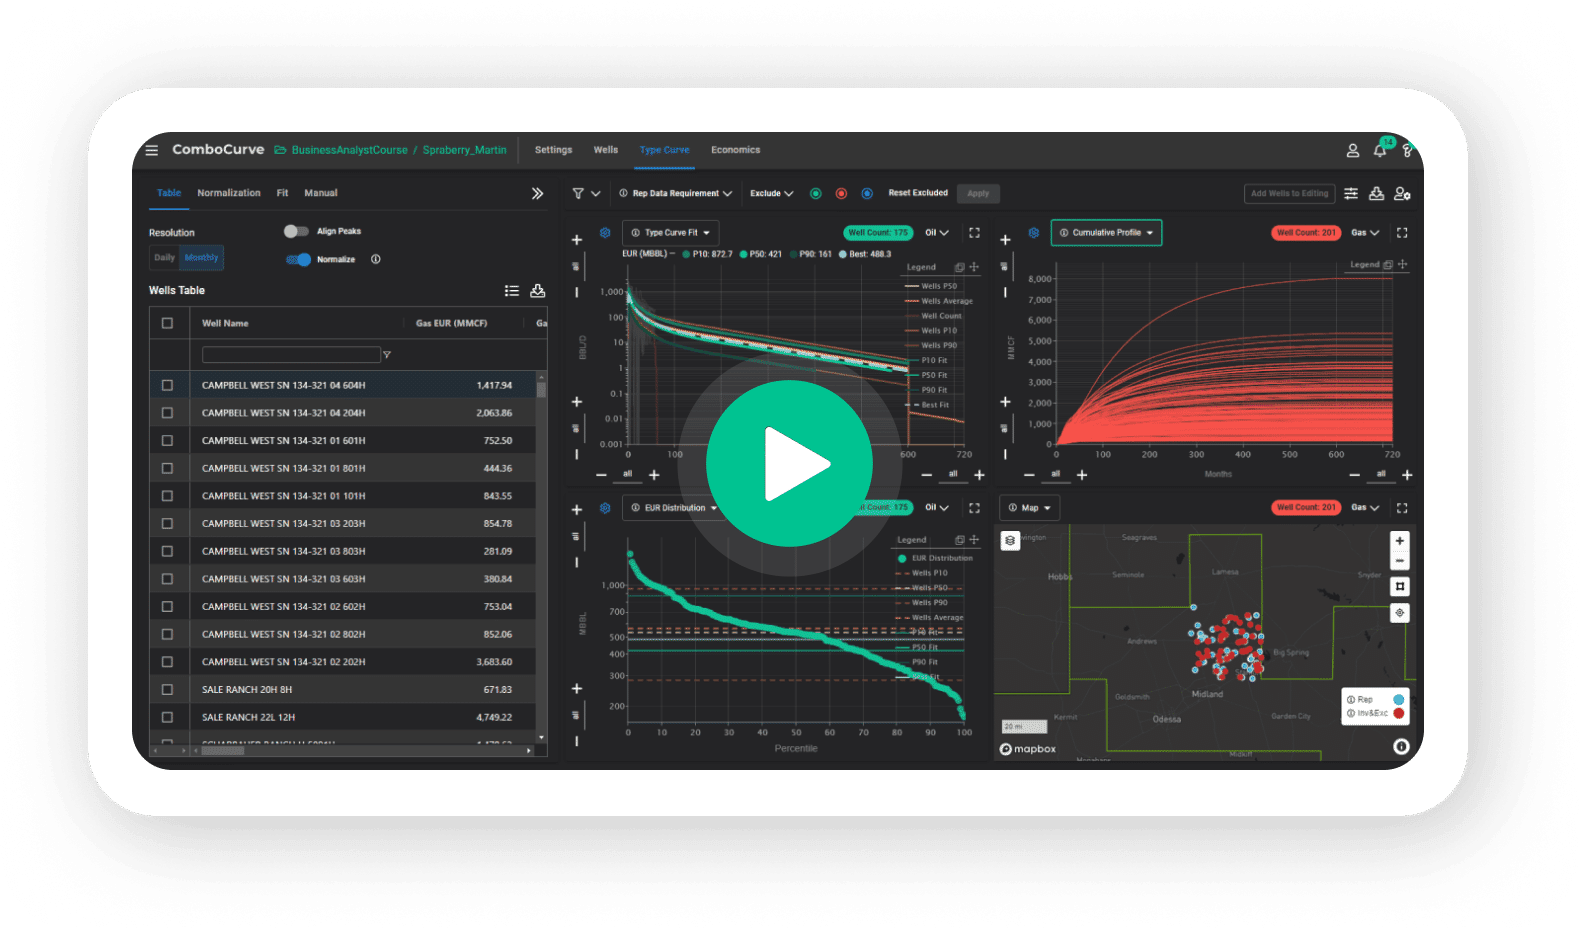
- Basin Wide Analysis: Generate type curves from production and forecasted volumes.
- EURs: Match type curve EURs to existing EURs to ensure good fits.
- Probabilistic: Probabilistic multi-segment P10, P50, and P90 type curves.
- Point-and-click: Point-and-click type curve diagnostics increases accuracy.
- Map View: Dynamic well selection including map view.
Economics
Key Features
- Assumptions: Create scenarios across a wide variety of assumptions like ownership, costs, pricing, taxes, and other settings.
- Daily Pricing: Access to daily strip pricing for Henry Hub, Brent, and WTI.
- Cut-offs: Automatically calculate economic cut-offs in the first pass.
- Scenarios: Run as many as 10 different scenarios at a time.
- Simultaneously calculate project and one-line economics. Ease of Use: So easy even your CEO can use ComboCurve.

See how EQT uses ComboCore to keep forecasts within 1% of actual production numbers.
Frequently Asked Questions About ComboCore
You can bring data into ComboCurve with a .csv file importer, a self-serve API, or with ComboSync.
Economic models are stored within a project. They can be unique to an individual well or available to use across any well in the project. You can also share models between projects. Some model types can be stored externally and pushed into ComboCurve through a Rest API or using ComboSync.
ComboCurve has several tools for editing forecasts. From single well auto-forecasting with limited parameters to very detailed manual forecasting where you directly change parameters or use keyboard shortcuts to manually manipulate your curves.
With ComoboCurve, you can create custom economic models for ownership and reversion, cutoffs, CAPEX, differentials, OPEX, pricing, stream properties, taxes, and risking. Import economic models via CSV and ARIES on the front-end or with ARIES or PHDwin on the back-end. Sync ownership and reversion information from an internal database using ComboSync.
ComboCurve gets its name from how the platform runs “combos,” or economic sensitivities, with ease. Calculate up to 10 combinations of applied economic models and up to 75,000 wells within a single economic run.
ComboCurve’s automatic forecasting tool is so fast, you can forecast very large well sets in minutes without slowing your computer down.
Yes, you can use maps and heatmaps in forecast sets, throughout type curve creation, in economic scenarios, and when visualizing forecast or economic results (EUR/ft heatmaps, NPV/IRR heatmaps, etc).
Select “Map” and zoom in using the map. Additionally, filter by any well header information brought into ComboCurve. Easily select based on one or multiple header criteria.
Yes, you can merge forecasts, scenarios, and projects in ComboCurve. Reserves Engineers can create independent forecasts for their wellsets and then you can merge them together in a single reserves forecast. You can duplicate forecasts, type curves, economic models, lookup tables, and scenarios from different projects. Click “See All”, search for the model you want to import, check the box next to it, and select “Import to Project”.
ComboCurve offers several options to export reports including integrated Power BI reports for economic sensitivities.